The problem
Buying energy storage is a data problem. Buyers compare products on dozens of technical and commercial attributes.
Before the library, the only way to see product details was to create a project first. Anza's engine then ranked complete systems, a battery paired with a power conversion system (PCS), or an all-in-one AC block, against that project's parameters, and buyers compared them in the ranking table.
There was no way to browse or compare the individual batteries and PCS on their own.
My role
I owned end-to-end product design for the library: information architecture, the core evaluation workflows, and the design system underneath them. I worked with product, engineering and the storage business lead from first concepts through launch.
The approach
Instead of starting with screens, I started with structure. The library had to organize three kinds of things, batteries, power conversion systems and suppliers, so buyers could move between them without losing their place.
Underneath, I built and documented a design system across Anza's four product lines (Platform, Solar, Storage and Transformer) in Figma, Storybook and Claude. Engineering built from the same components in production, so new library surfaces shipped consistent by default.
Because the system was already in place, design took two weeks from first concepts to handoff to engineering.
Designing for the job
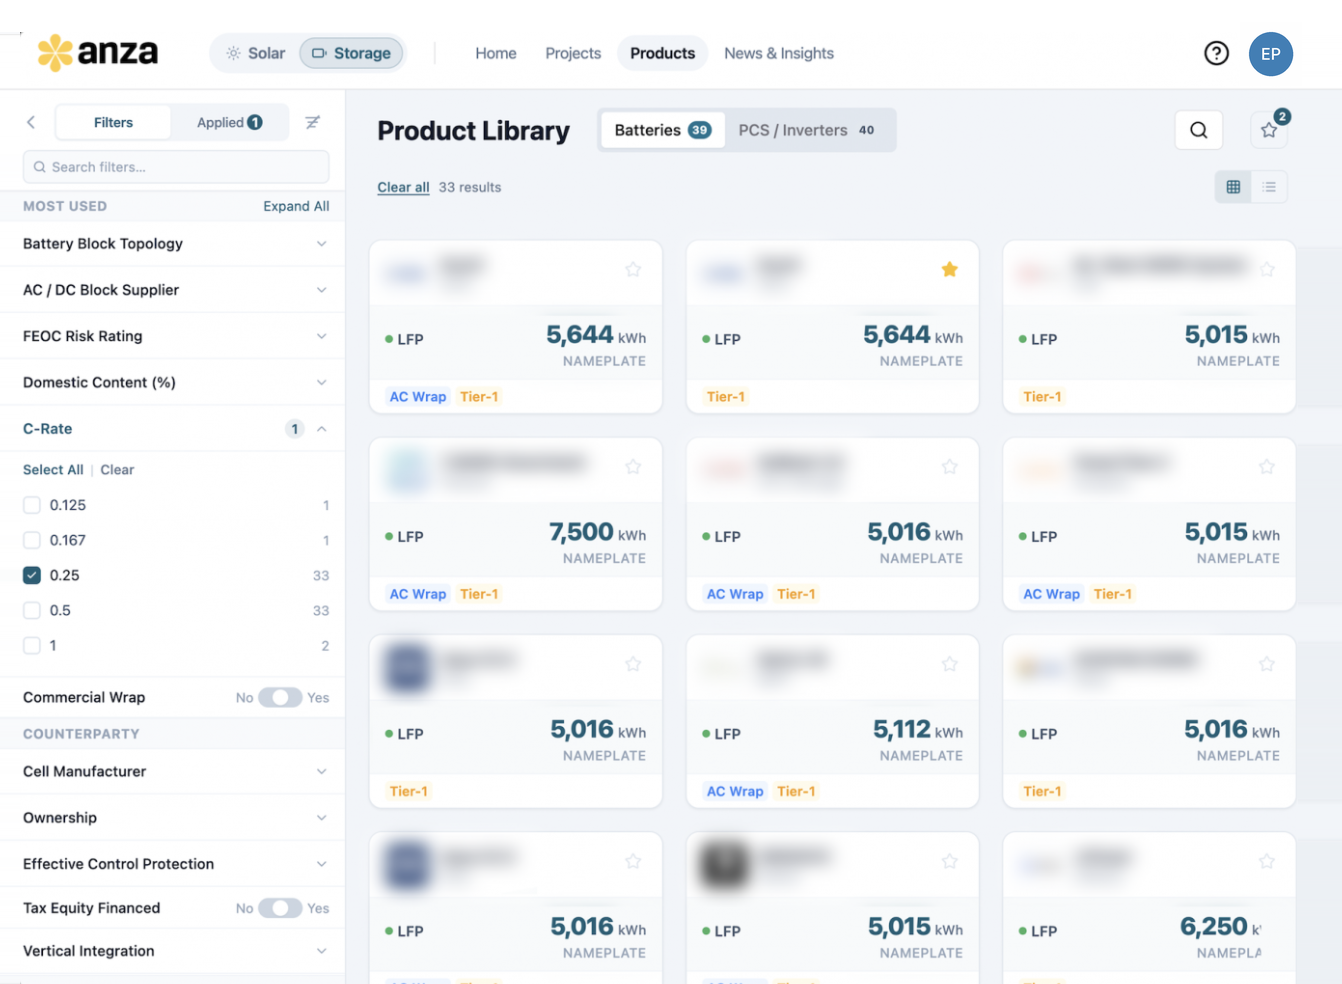
Battery buyers come with specific questions. I framed the library around the jobs buyers come to do: check pricing, read the degradation curve, choose a C-rate, verify documents and certifications, and narrow the field with filters. Each job had a measurable definition of done before any UI was drawn.
Each job became a tool on the product page: tabs for pricing, specifications, safety and certification, and documents, plus interactive degradation and C-rate tools. Defaults mattered: 74% of C-rate selections landed on 0.5C.
Filters were built around how buyers screen products. The most used were nameplate energy, FEOC risk, domestic content, commercial wrap and manufacturer.
How we measured it
With product, I defined success before launch: the share of library-active companies completing each job, with a 30% target, plus goals for depth and return. Every session was traced from where it started, through the libraries it touched, to the furthest step it reached.
Adoption
The library launched on May 27, 2026. Within five months, 89% of entitled storage subscribers were active, and an average of 82% of platform-active accounts reached the library each month from June to September. Its share held between 70% and 88% from launch onward.
Product Library reach, by month (2026)
Companies active on the platform, in the library, and in the supplier directory. % = library share of platform-active.
Every job cleared its goal
Among library-active companies, 93% viewed pricing, 87% reached documents and 81% viewed the degradation curve, each against a 30% goal. 66% of users touched three or more tabs in a session (goal 40%), and 67% returned within four weeks (goal 50%).
Every core job cleared its adoption goal
Share completing each job in the first five months; the black tick is the goal set at launch.
Because the patterns were already in the system, the supplier directory reached half of active companies within two months of launch.
Expansion: the supplier directory
The supplier directory launched on September 11, 2026 on the same foundation. In October it reached 52% of platform-active companies.
Reflection
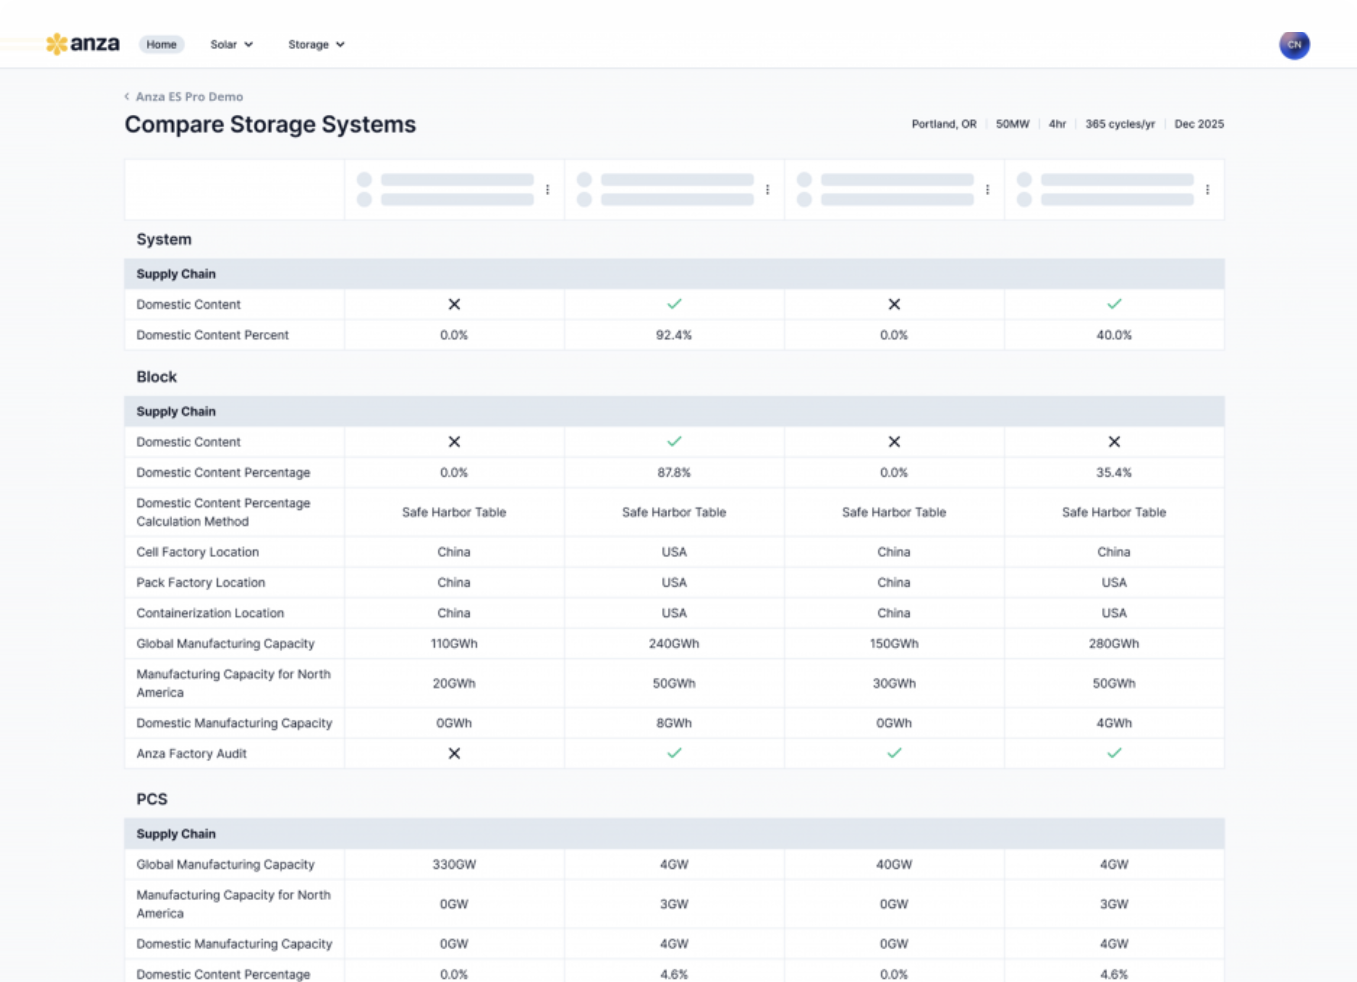
What came next. Alongside the library, we built the supplier directory, then connected the two: buyers can now compare products from the library and suppliers from the directory side by side. That comparison has shipped.
Still open. Only 21% of opened request forms were sent. Buyers were finding products they wanted, then stalling at the handoff to the supplier. That's the next job I'd define and design for.
What I learned. Defining done for each job before drawing any UI changed the whole project. It kept the design focused on the work buyers came to do, made the launch conversation about evidence instead of opinions, and pointed straight at the next problem worth solving.